

Predictive maintenance
Anomaly detection and threshold-breach forecasting on any measurement, inside a flow
Two flow nodes turn any numeric measurement into early warnings, with no model to train and no data science stack:
- Anomaly detection flags values that do not look like the recent behaviour of the series — a spike, a drop, a change of regime — without a fixed threshold.
- Forecast extrapolates the series and tells when it will cross a threshold: bearing temperature, filter pressure drop, battery voltage, tank level.
Both run in-process in the flow runtime (pure Rust), keep one history per series in Valkey (it survives redeploys), and expose a boolean output made to drive a Notification.
This page builds the complete example below on simulated data, so it works without any hardware: a pump whose vibration spikes every 90 s and whose bearing slowly heats towards 80 °C.
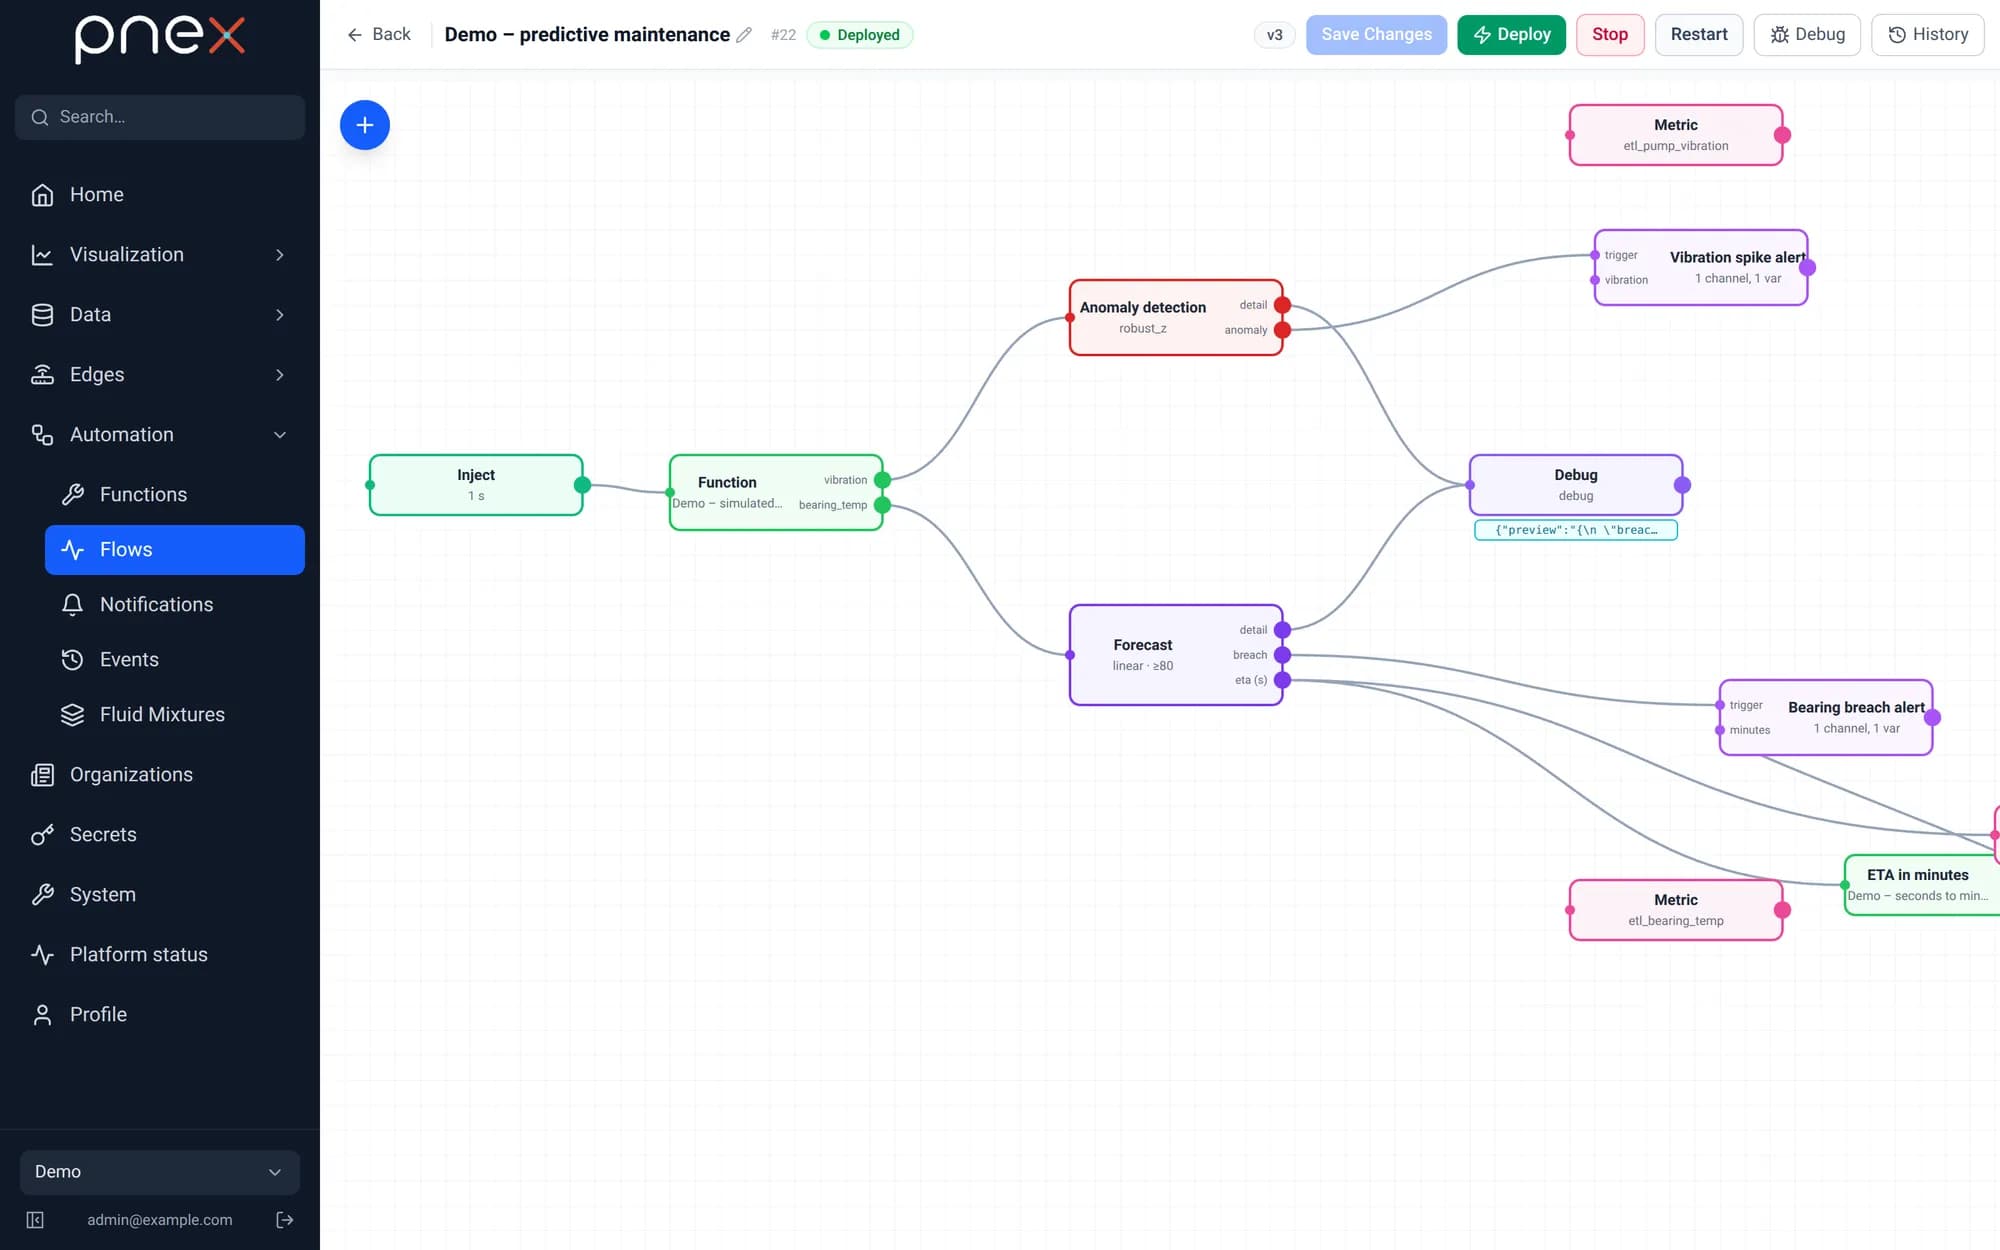
1. Simulate the measurements
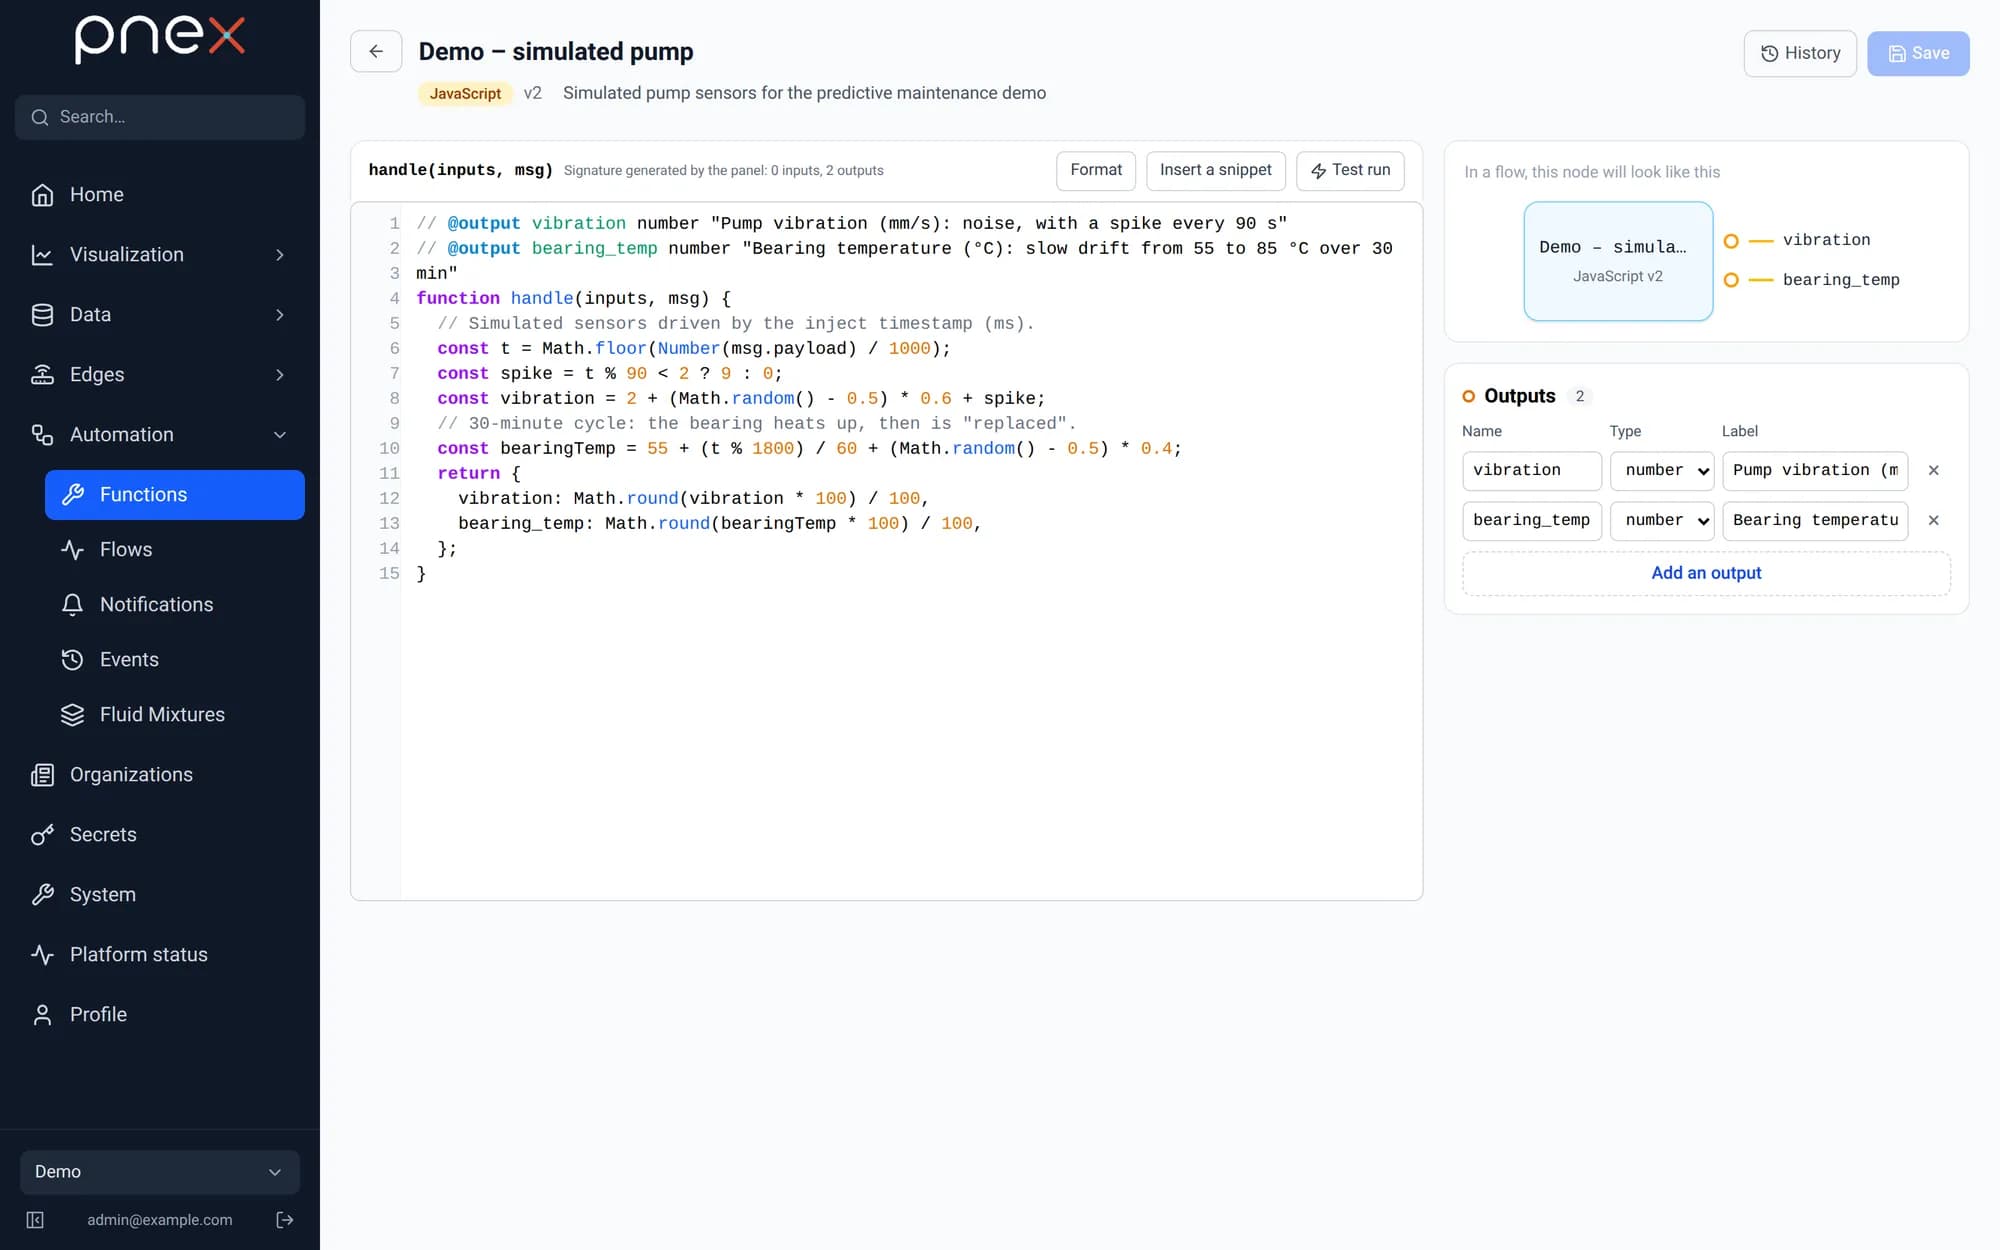
No sensor at hand? A function can generate realistic series. An Inject node without payload emits the current timestamp every second; the function turns it into two measurements, one per output port:
// @output vibration number "Pump vibration (mm/s): noise, with a spike every 90 s"
// @output bearing_temp number "Bearing temperature (°C): slow drift from 55 to 85 °C over 30 min"
function handle(inputs, msg) {
  // Simulated sensors driven by the inject timestamp (ms).
  const t = Math.floor(Number(msg.payload) / 1000);
  const spike = t % 90 < 2 ? 9 : 0;
  const vibration = 2 + (Math.random() - 0.5) * 0.6 + spike;
  // 30-minute cycle: the bearing heats up, then is "replaced".
  const bearingTemp = 55 + (t % 1800) / 60 + (Math.random() - 0.5) * 0.4;
  return {
    vibration: Math.round(vibration * 100) / 100,
    bearing_temp: Math.round(bearingTemp * 100) / 100,
  };
}
With a real device, replace the inject + function by a Device (read) node on the pin, or any node producing a number.
2. Detect anomalies
Wire vibration into Anomaly detection. The node warms up (30 samples by
default), then scores every value against the window of its series.
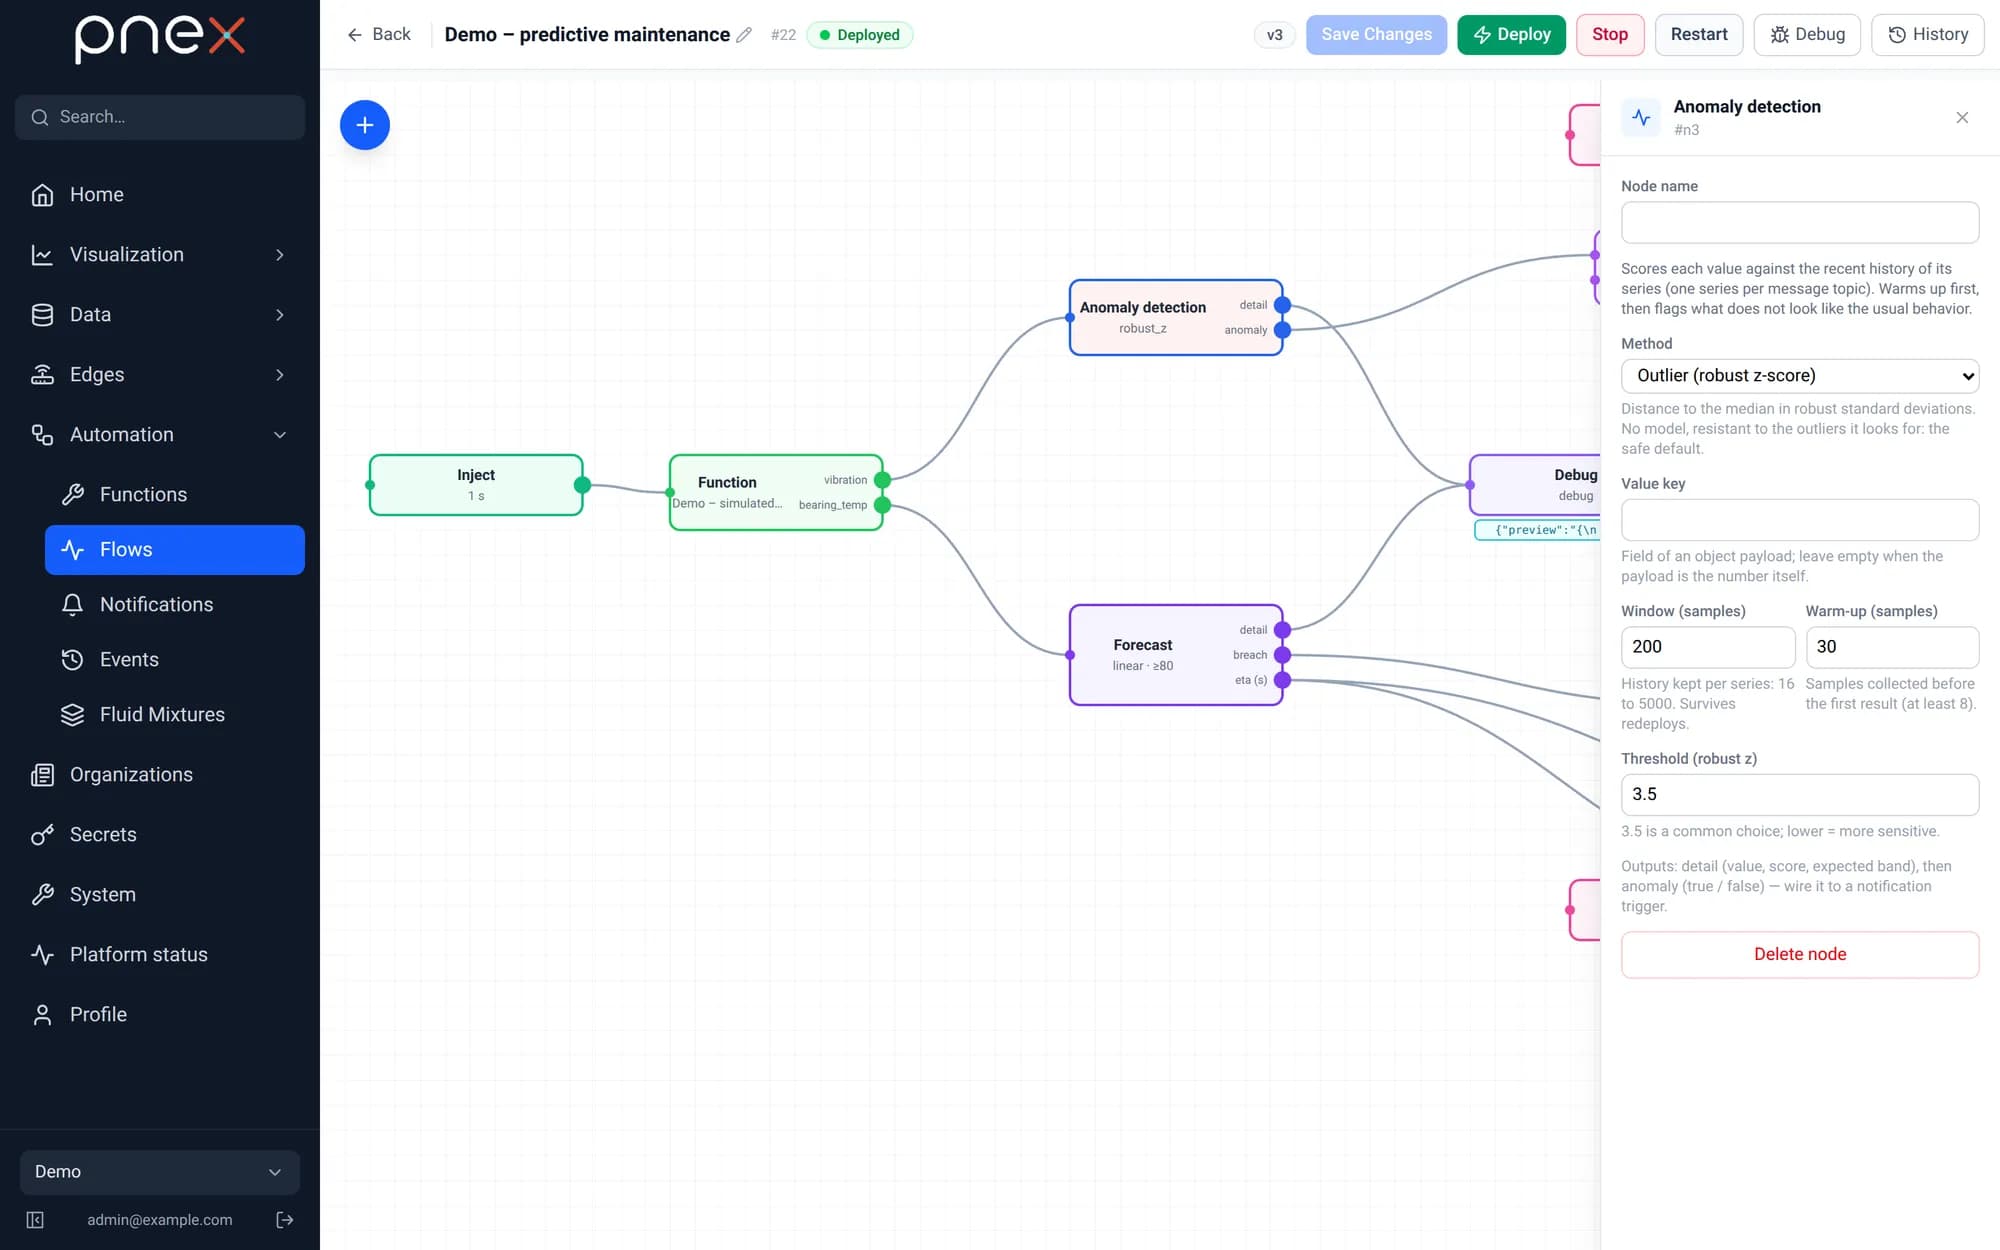
| Method | Detects | When to use it |
|---|---|---|
| Outlier (robust z-score) | Isolated spikes and drops | The safe default: no model, not fooled by the outliers it looks for |
| Out of forecast band | Values outside the predicted band | Series with a trend or a daily cycle (set the season) |
| Regime change | A lasting change of level or variability | After a failure, an intervention, a setting change — fires once per change |
Outputs: detail (value, score, expected band) and anomaly (true / false).
In the example, each vibration spike scores around 38 for a threshold of 3.5; the noise
never crosses it.
3. Forecast the breach
Wire bearing_temp into Forecast, pick the model and set the threshold.
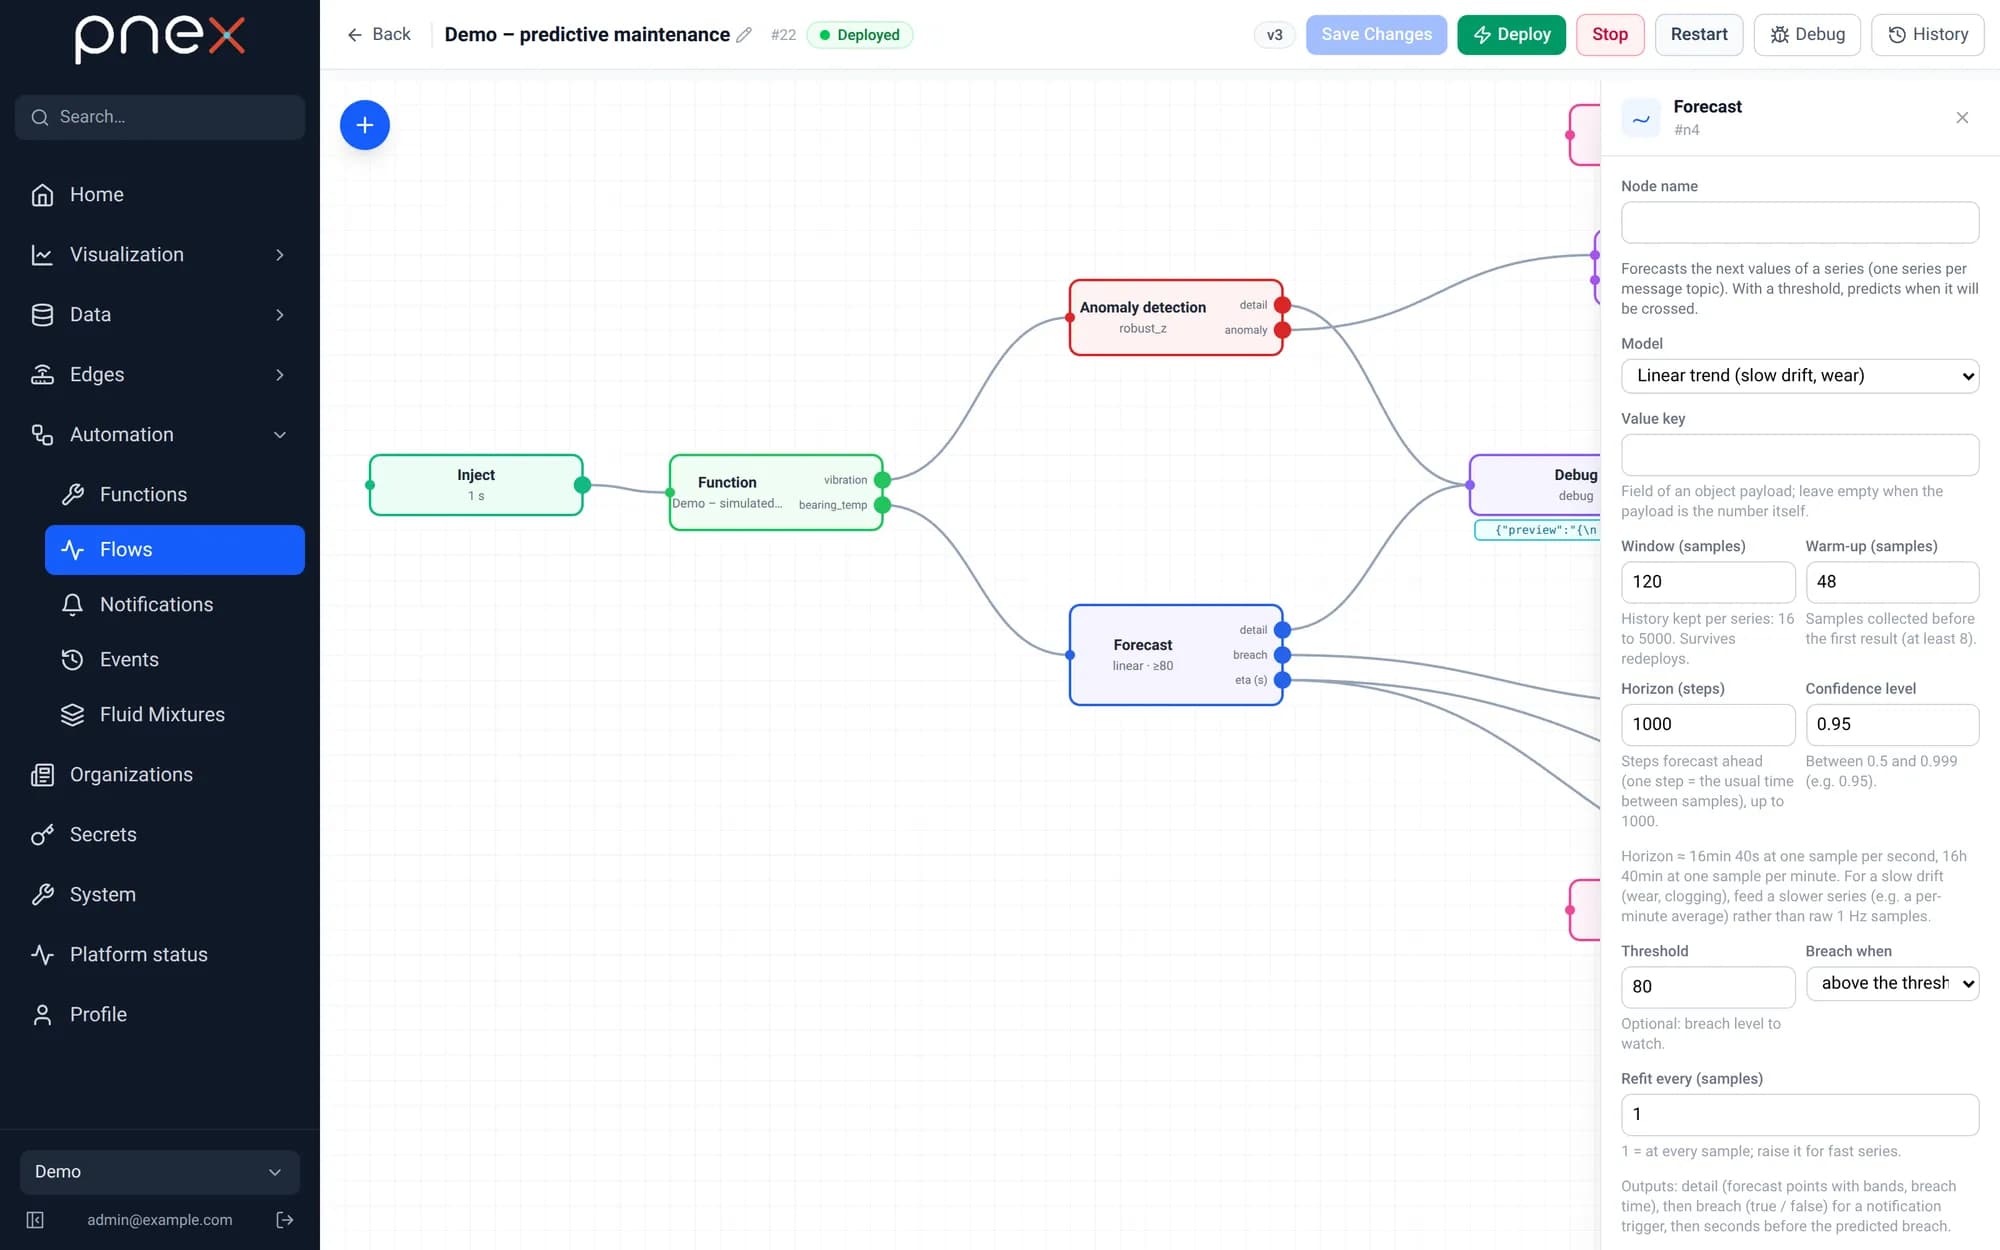
| Setting | Example | Why |
|---|---|---|
| Model | Linear trend | Slow drift and wear. Exponential smoothing suits series with seasonality |
| Window | 120 samples | Recent history used for the fit — shorter adapts faster after a maintenance |
| Horizon | 1000 steps | How far ahead to look; one step = the usual interval between samples |
| Threshold / Breach when | 80, above | The level to watch |
Outputs: detail (forecast points with confidence bands, breach time), breach
(true when the threshold is predicted to be crossed within the horizon) and
eta (s) (seconds before the predicted crossing).
In the example, at 66.7 °C and +1 °C per minute the node predicts the breach in 791 s — the exact answer is 800 s — and the ETA then counts down with the clock.
The horizon decides how early you are warned. The default (48 steps) only looks 48 s ahead on a series sampled every second: raise it for slow phenomena, or sample less often (a Forecast fed once a minute with a 1000-step horizon looks 16 hours ahead).
4. Alert on the phone
Wire the boolean outputs to the trigger of a Notification node, and the values to the template variables:
- anomaly → trigger of Vibration spike alert,
vibration→ itsvibrationvariable; - breach → trigger of Bearing breach alert, eta (s) → a small function that
rounds it to minutes → the
minutesvariable of the templateBearing temperature forecast to reach 80 °C in about {{ minutes }} min.
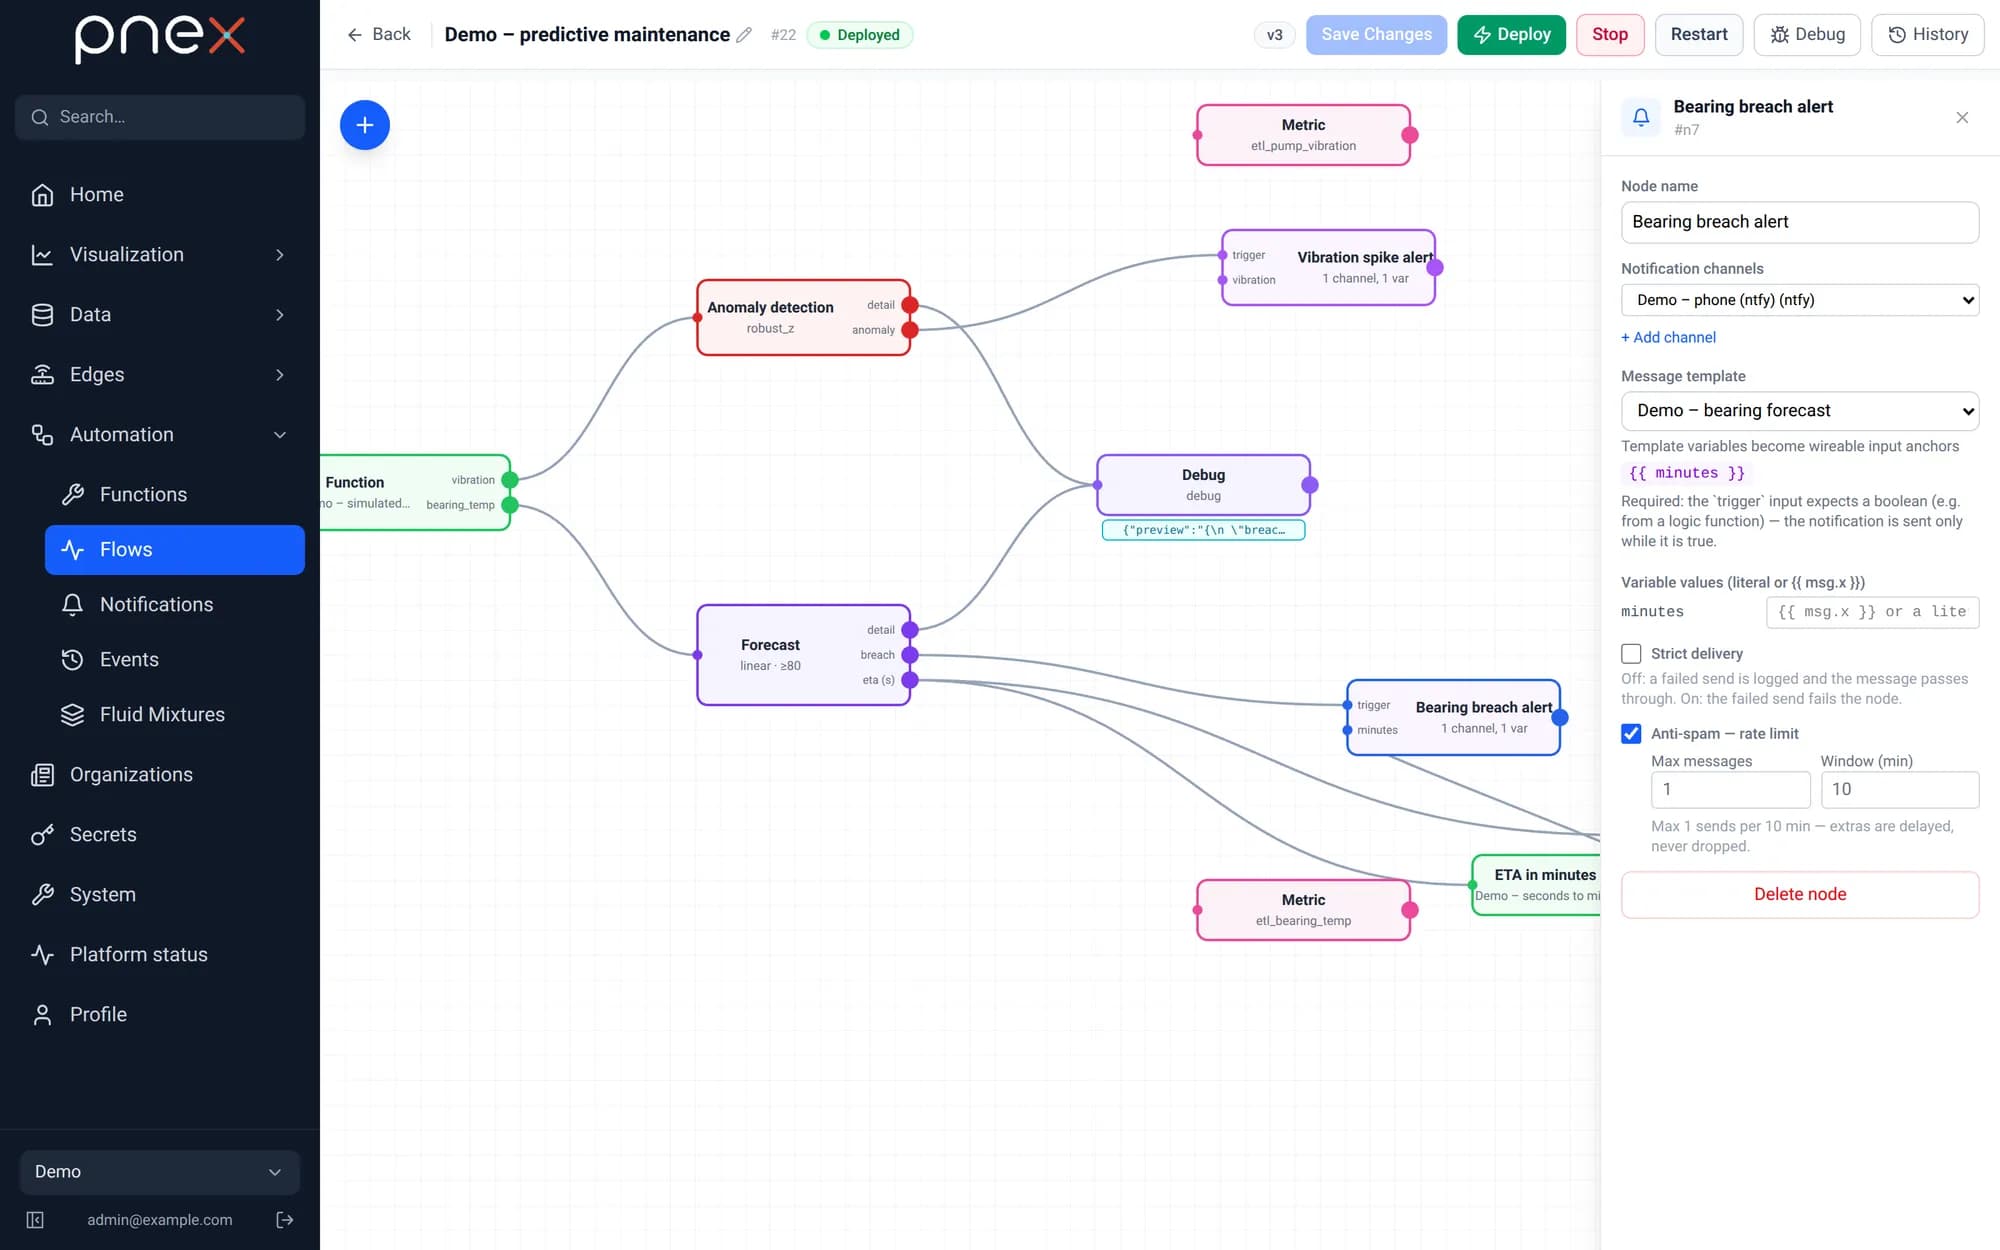
Set the anti-spam (here 1 message per 10 minutes): a forecast stays in breach for as long as the trend holds.
Screenshot coming soon
public/screenshots/v0.1/v0.1/en/phone/ntfy-predict.webp — capture scenario: scripts/capture/run.mjs
5. Watch it on a dashboard
Add Metric nodes on the measurements and on the ETA: they appear as sources
flow_<id> in the dashboards — gauge for the temperature, value
for the predicted breach, mini charts for the drift and the spikes.
Good to know
- One series per message topic: a single node can watch several measurements if their messages carry different topics.
- History survives redeploys (Valkey, kept 30 days).
- Numbers only: booleans count as 1/0; an object payload is read through the Value key setting. Anything else is rejected, never guessed.
- The node badge and the Debug node show the latest result; a long horizon makes the detail large (one point per step), so the Debug node shows a truncated preview.