

See a room's temperature on a dashboard
Put the temperature and humidity of your climate sensor on a phone dashboard and on a desktop screen, with a 24-hour chart and a card that greys out when the sensor goes quiet
In Temperature alerts with your own firmware you built
climate-1, an ESP32-C6-Zero that publishes temperature and humidity to your PNeX
server. Now you will look at those values: a card in the Bedroom of a phone
dashboard, and a desktop screen with the value, a humidity gauge and a 24-hour chart.
A dashboard only reads: no flow is needed to display a value.
Check that the sensor publishes
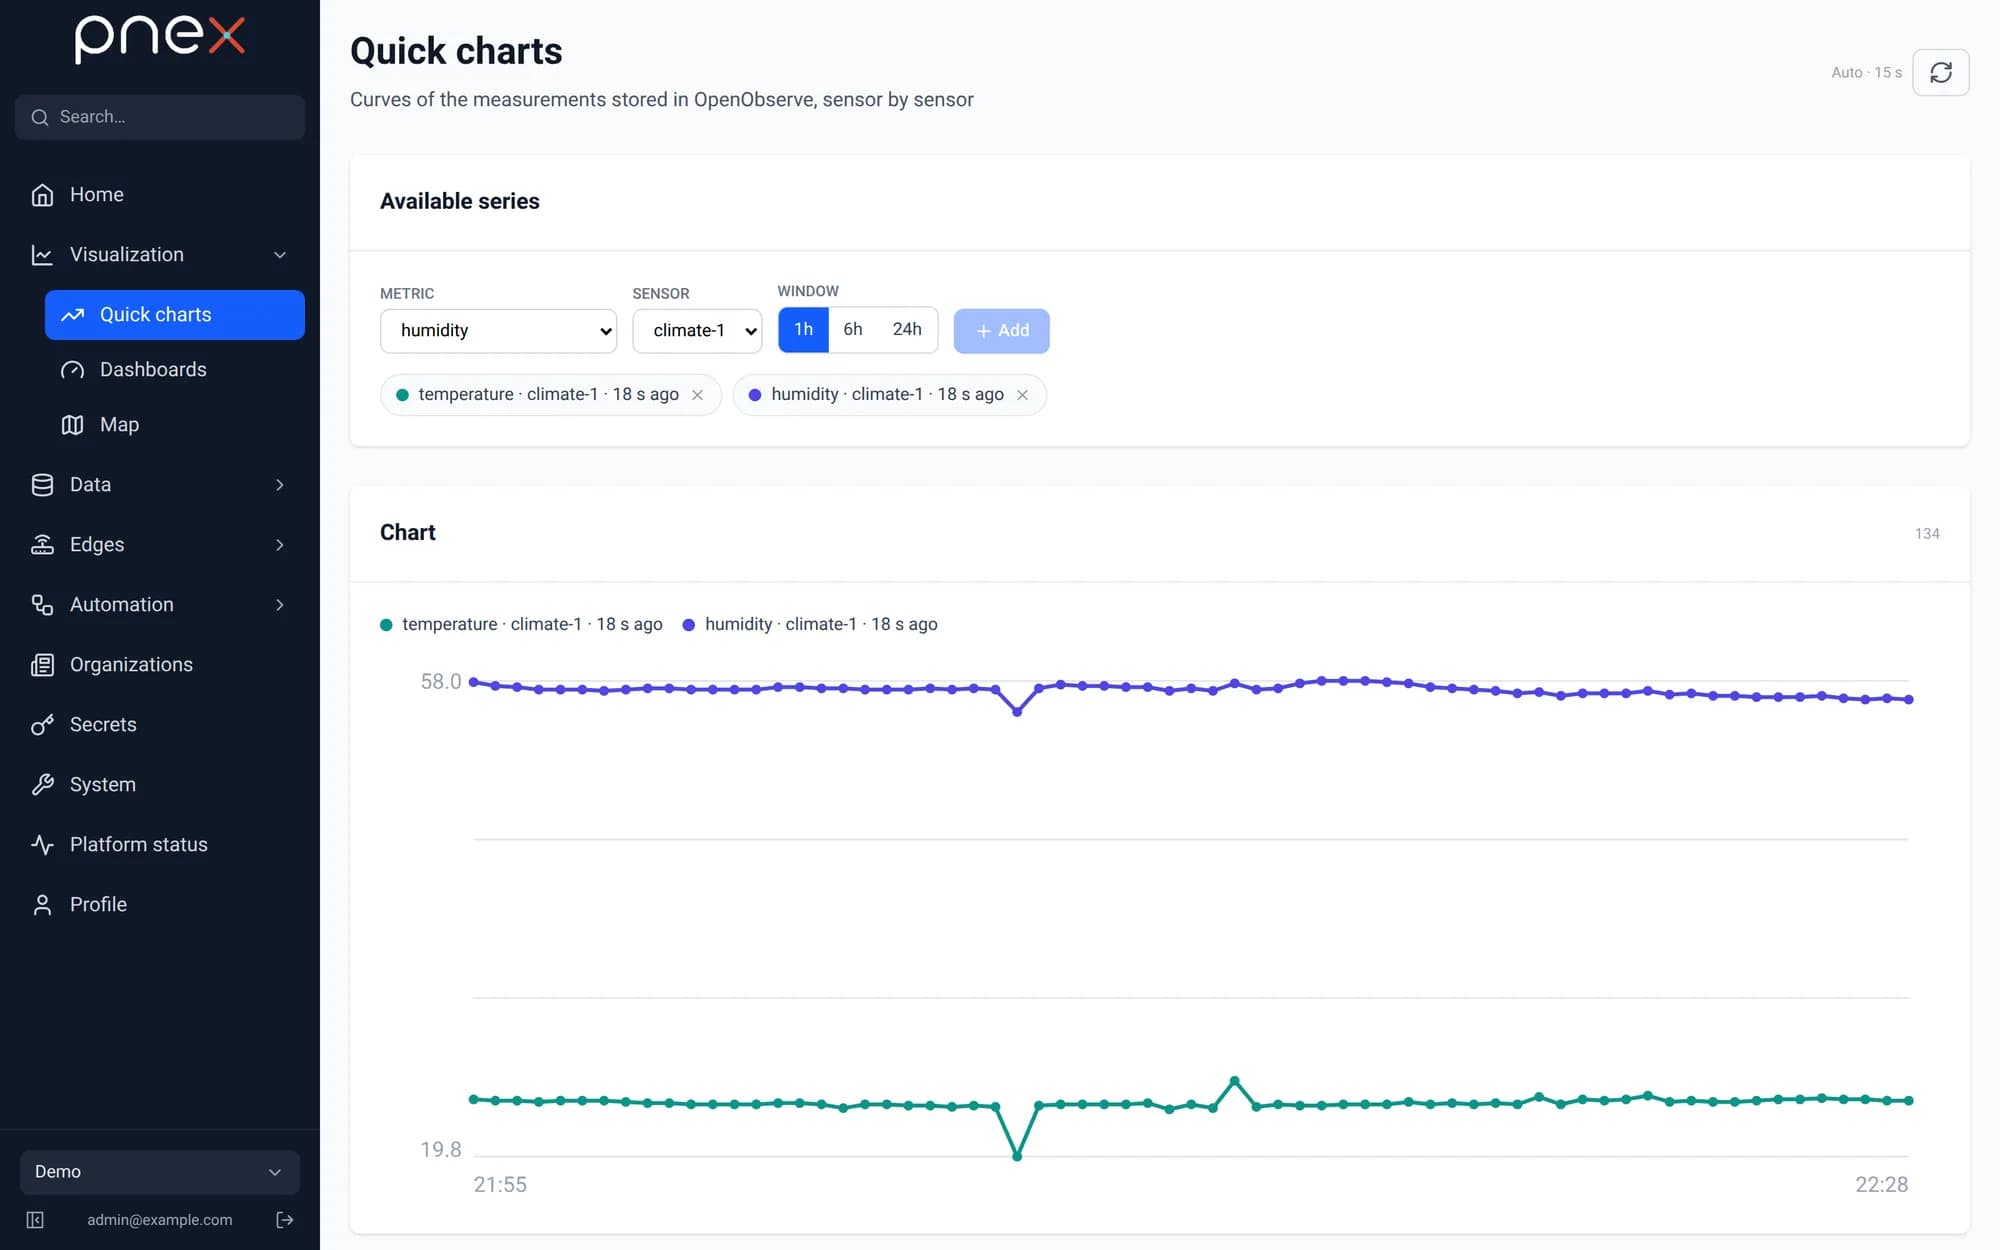
Open Visualization → Quick charts and pick climate-1: the temperature and
humidity curves must move every 10 seconds.
Dashboards list the series published in the last 24 hours. A board that has been unplugged for longer only comes back in the lists once it publishes again.
Create the phone dashboard
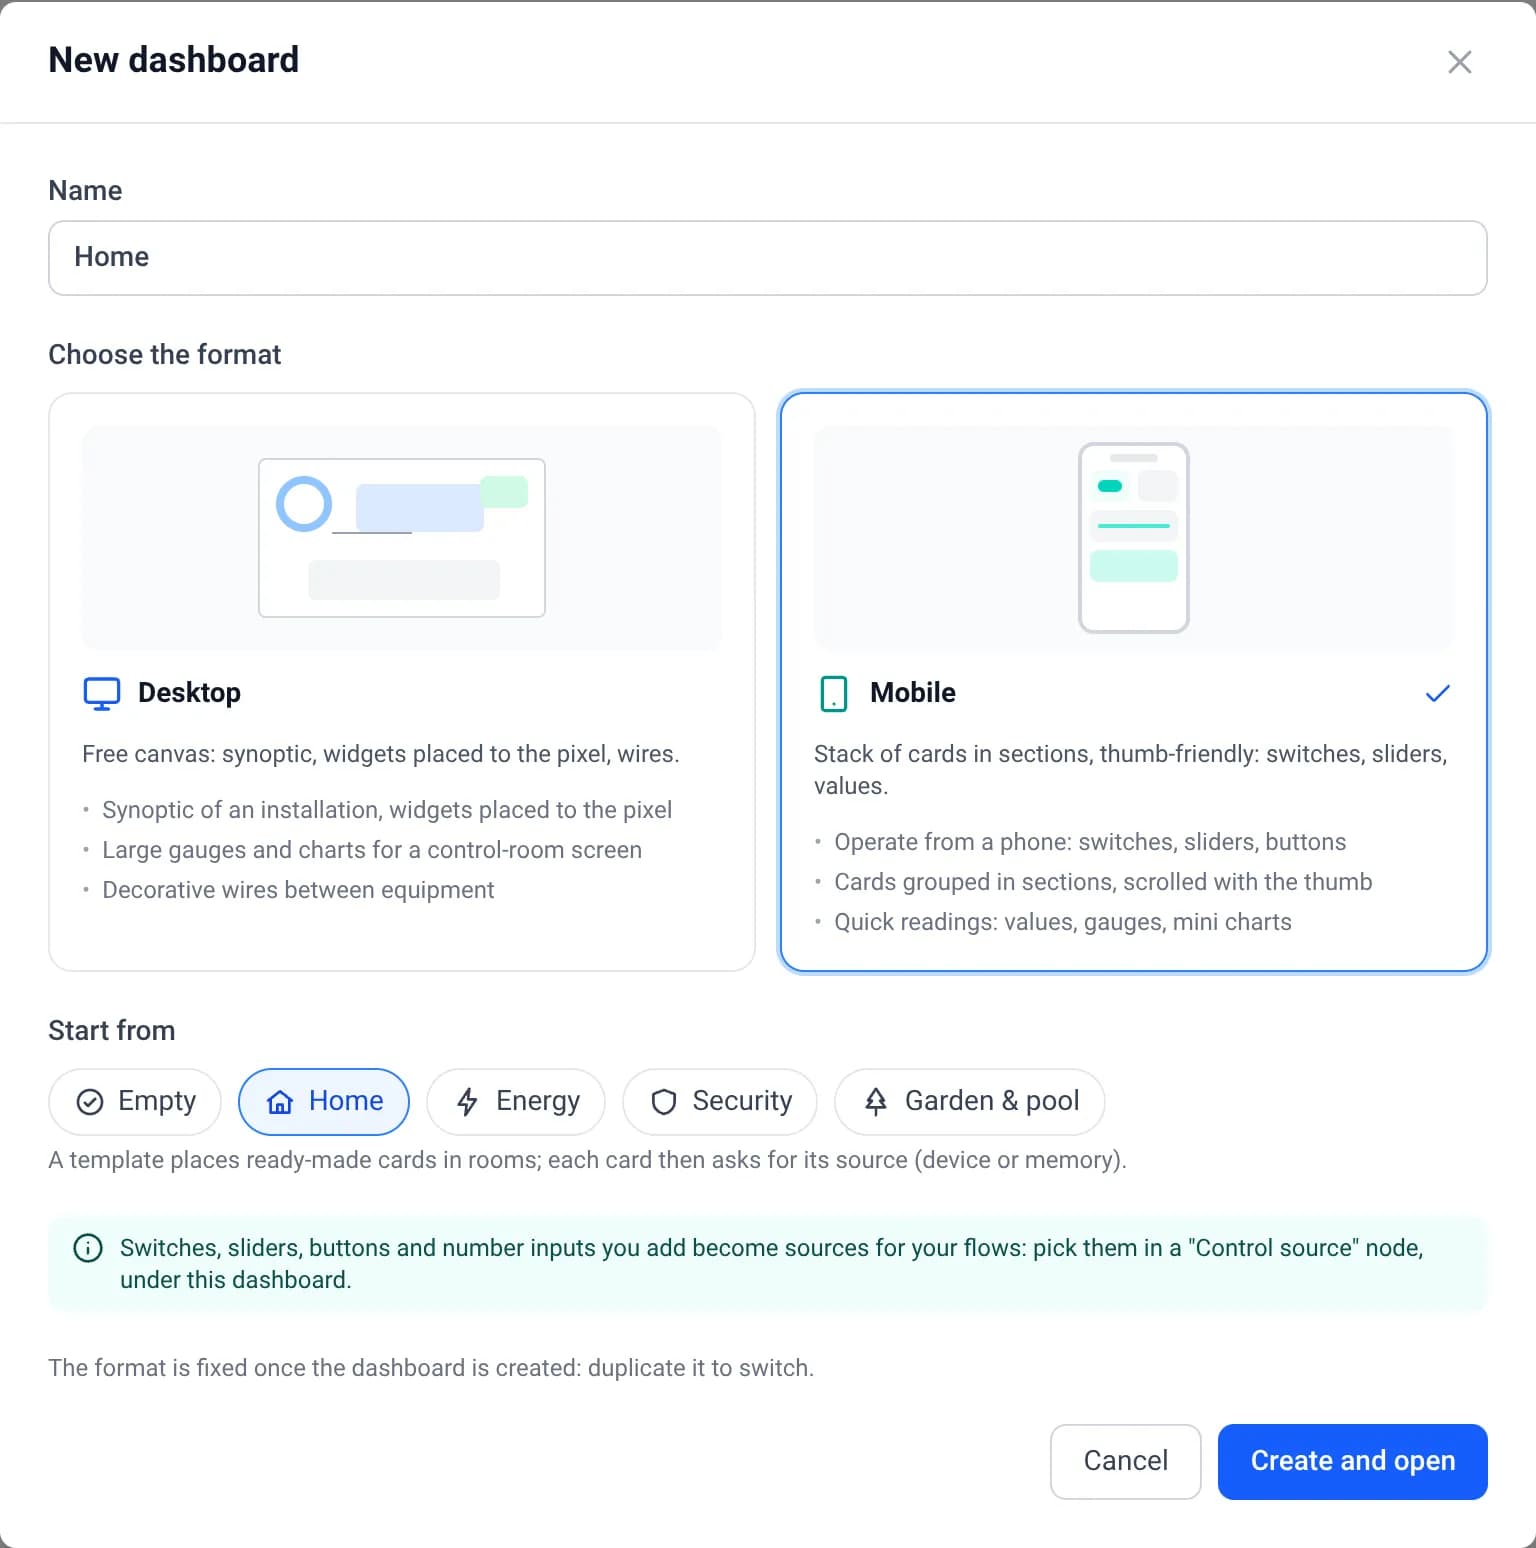
Open Visualization → Dashboards → New dashboard. Name it Home, choose
Mobile, then Start from the Home template, and click Create and open.
The template lays out a few rooms. In Bedroom, the Temperature card is marked To configure: it is waiting for a sensor.
Bind the card to the sensor
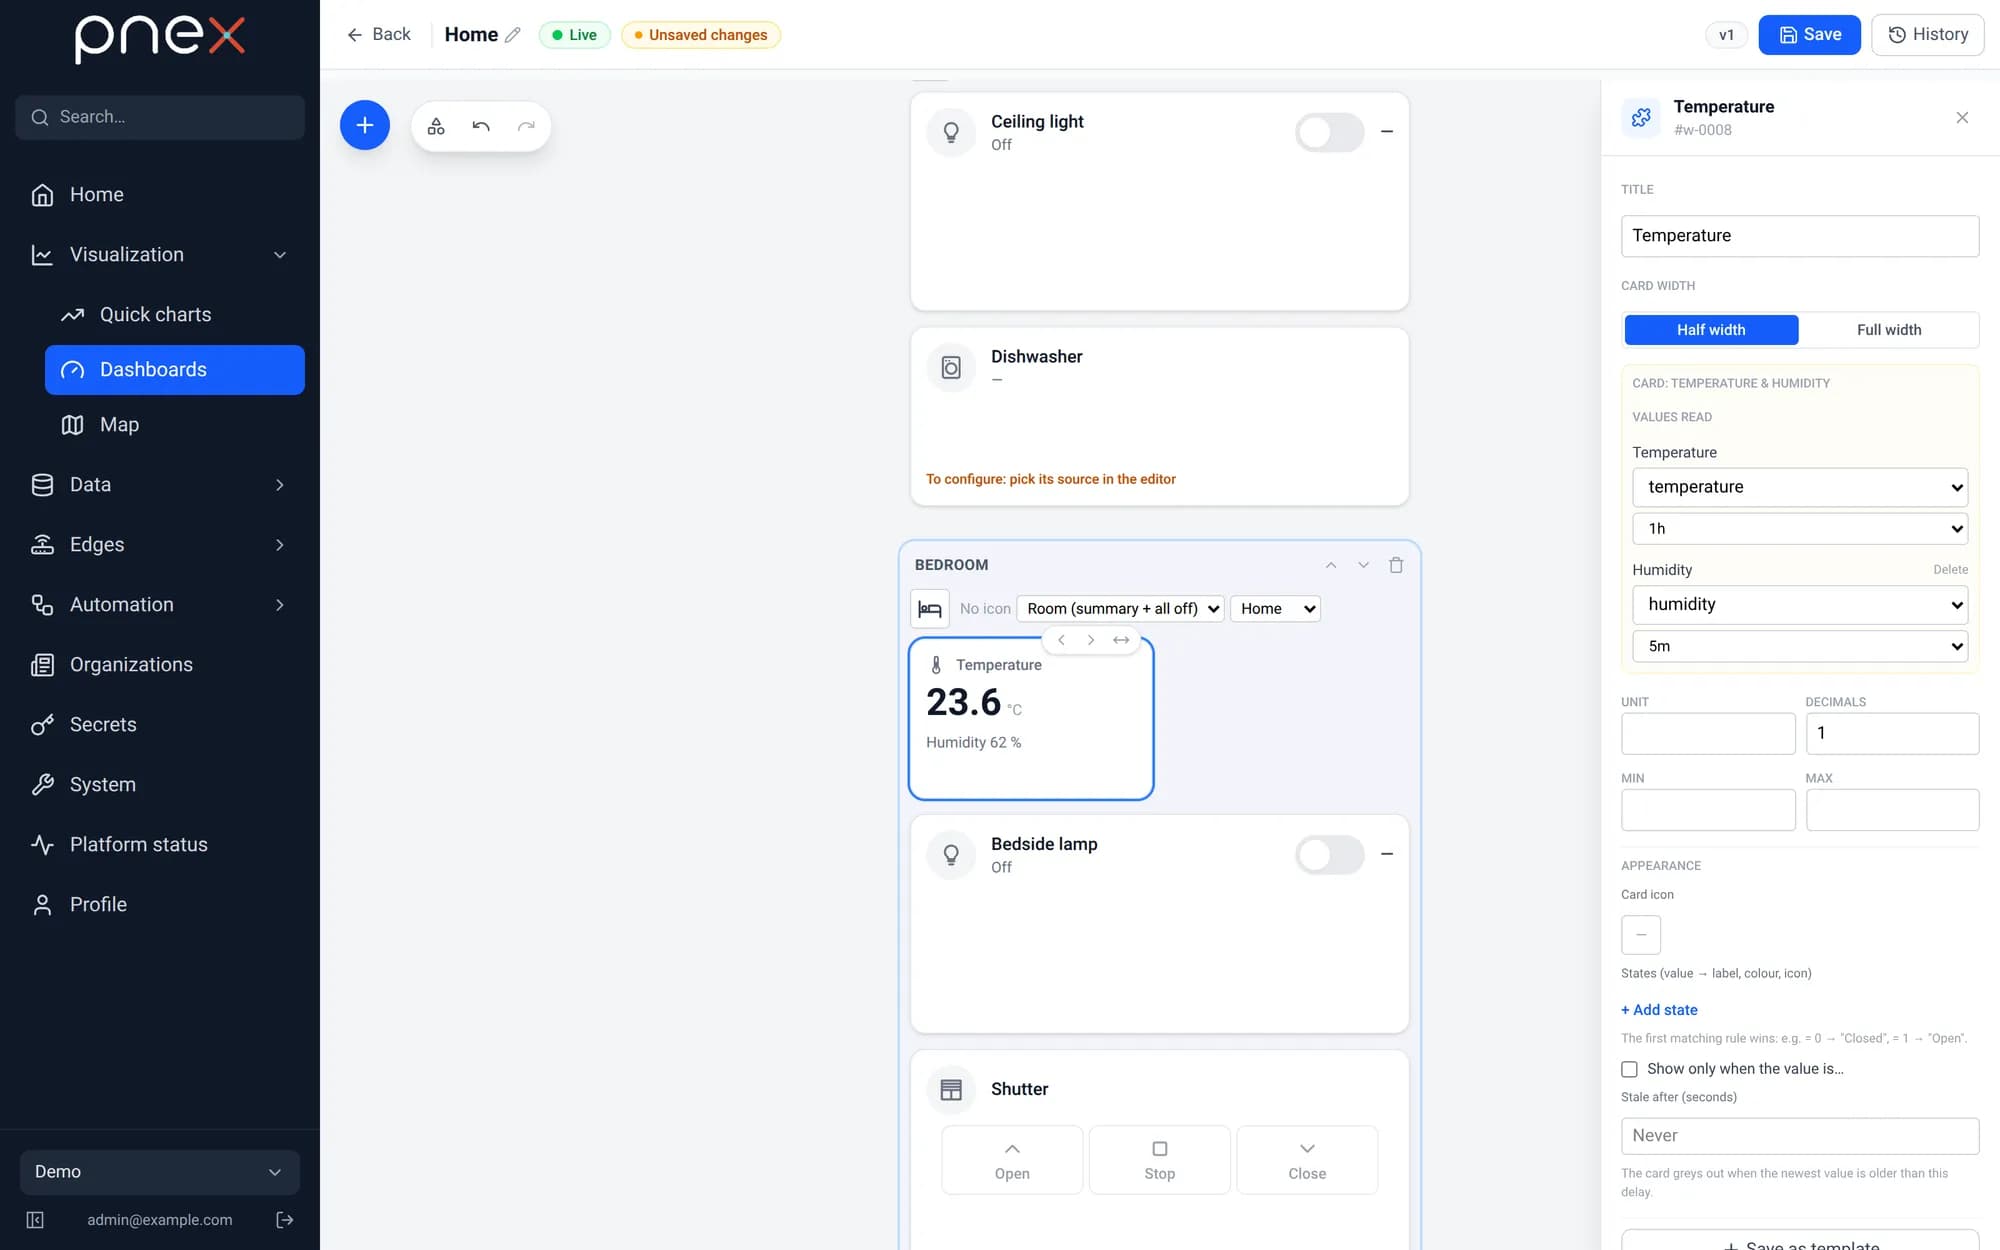
Click the Temperature card of the Bedroom. In the inspector, under Values read:
- Temperature →
temperature(underclimate-1); - Humidity →
humidity(underclimate-1).
Keep the 1h window: the card shows the latest value of that window.
Shortcut: + → From a device, pick climate-1, then click Temperature &
humidity under temperature. This adds a new card already bound to both metrics.
Grey it out when the sensor goes quiet
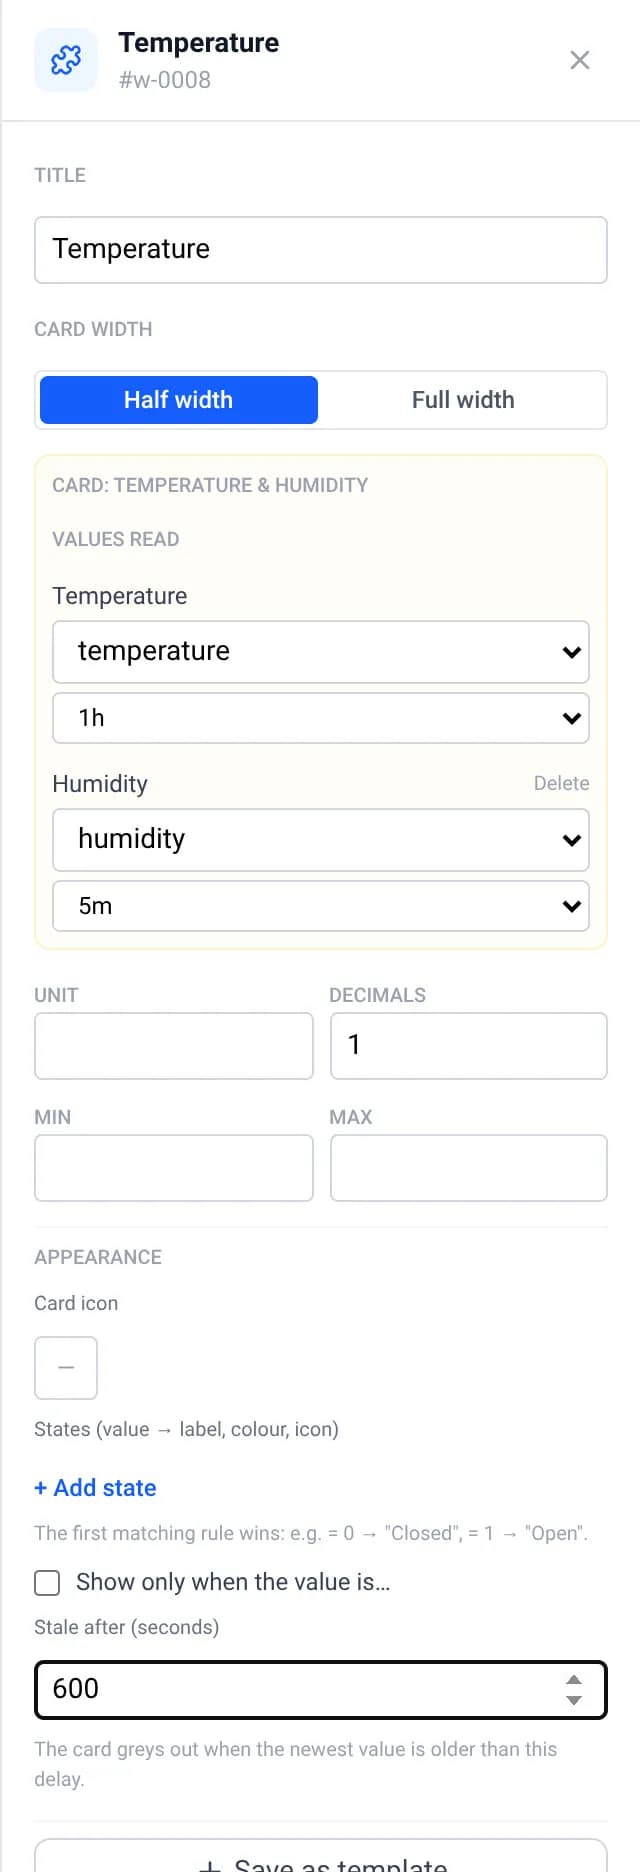
Still in the inspector, under Appearance, set Stale after (seconds) to 600.
The sensor publishes every 10 seconds. If nothing arrives for 10 minutes (board unplugged, Wi-Fi lost), the card greys out instead of showing an old temperature as if it were current.
Click Save.
Open it on your phone
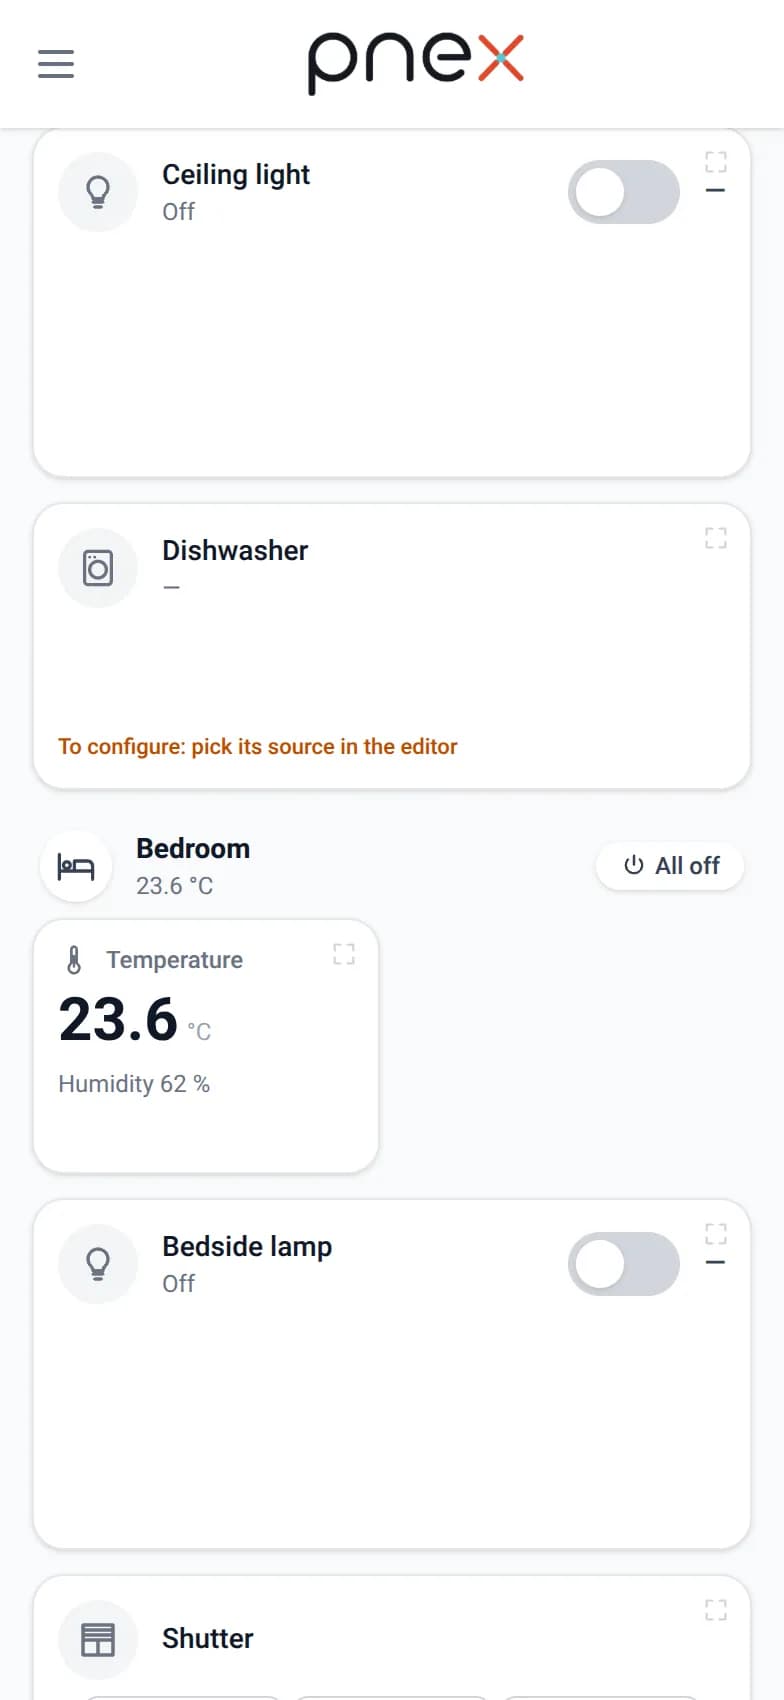
On your phone, open PNeX (the app or the browser), then Visualization → Dashboards → Home. The Bedroom header shows the room temperature, and the card shows both values.
Tap the Details and history icon in the corner of the card: a sheet opens with the curve of the last 24 hours, its minimum and its maximum.
Create the desktop dashboard
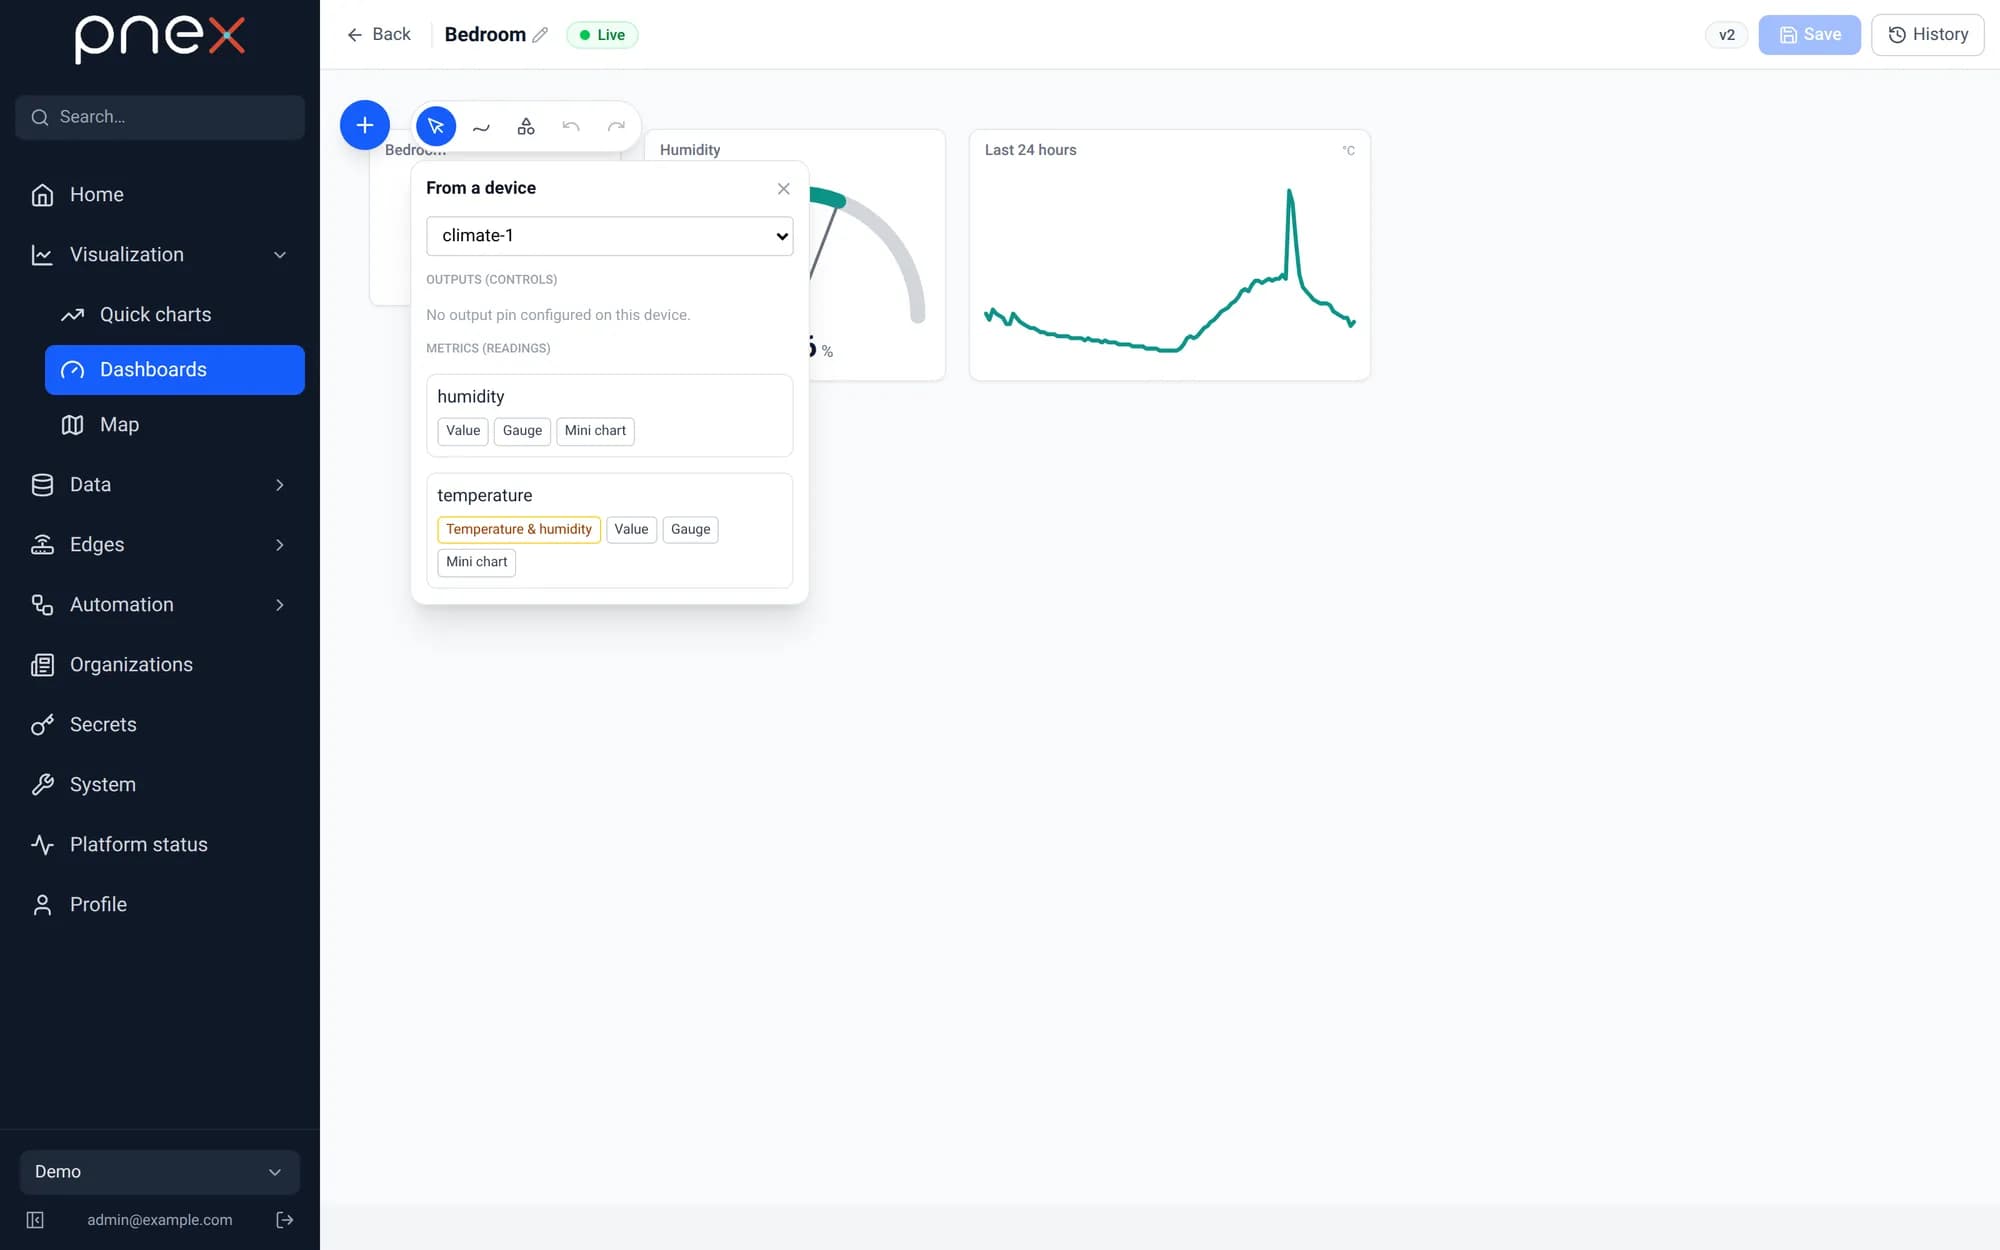
For a wall screen or your computer, a Desktop dashboard places widgets freely.
Click New dashboard, name it Bedroom, choose Desktop and click Create and
open.
Click +, then From a device, and pick climate-1. Under each metric:
temperature→ Value: the big number;humidity→ Gauge;temperature→ Mini chart.
The widgets land side by side. Drag them where you want, and resize them from their corner.
Tune the widgets
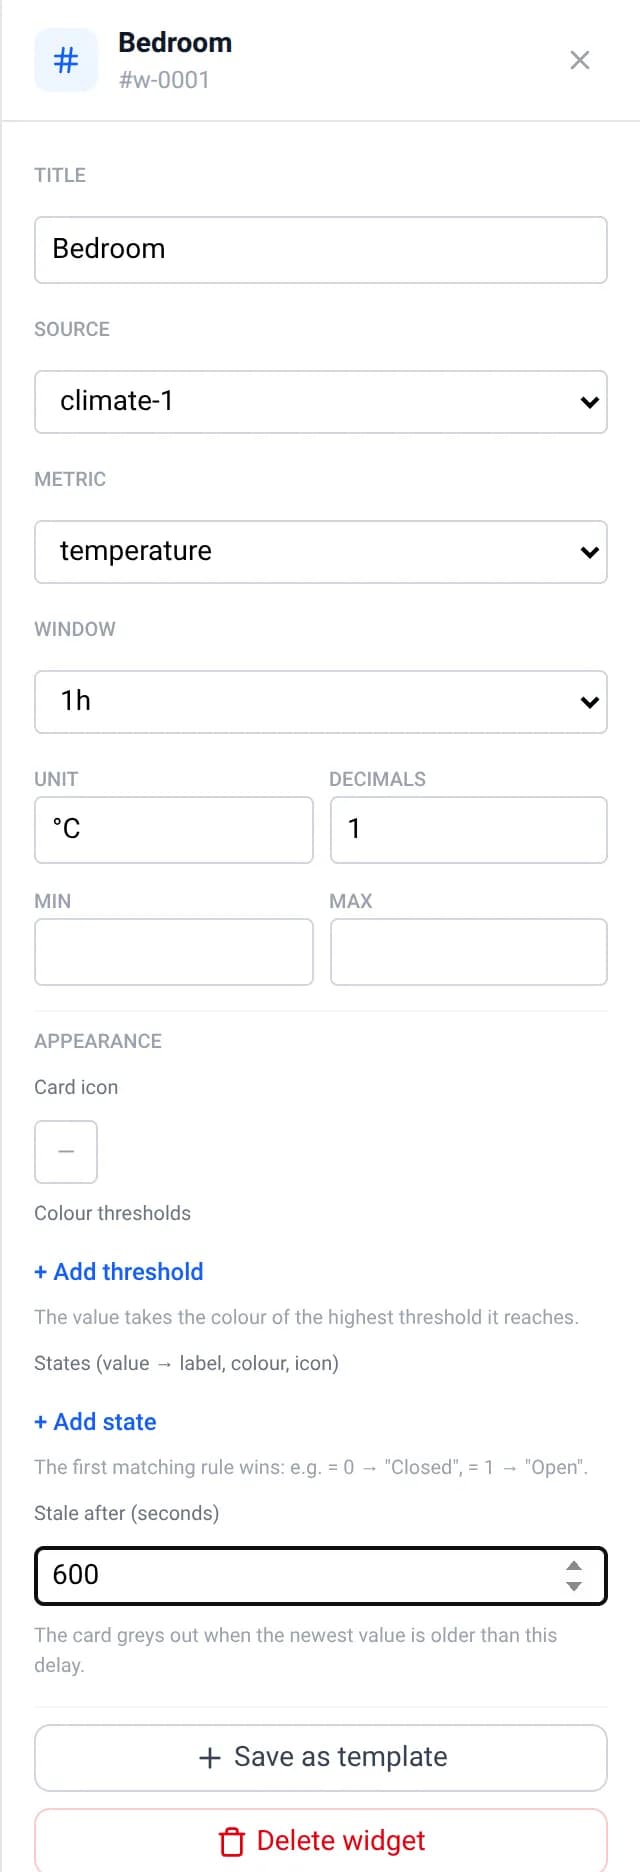
Select each widget and adjust it in the inspector:
- Value: title
Bedroom, unit°C, Stale after600; - Gauge: title
Humidity, unit%, min0, max100; - Mini chart: title
Last 24 hours, unit°C, window24h.
Under Appearance → States you can colour the value, for example blue below 18
and red above 26.
Click Save, then Back.
The desktop screen
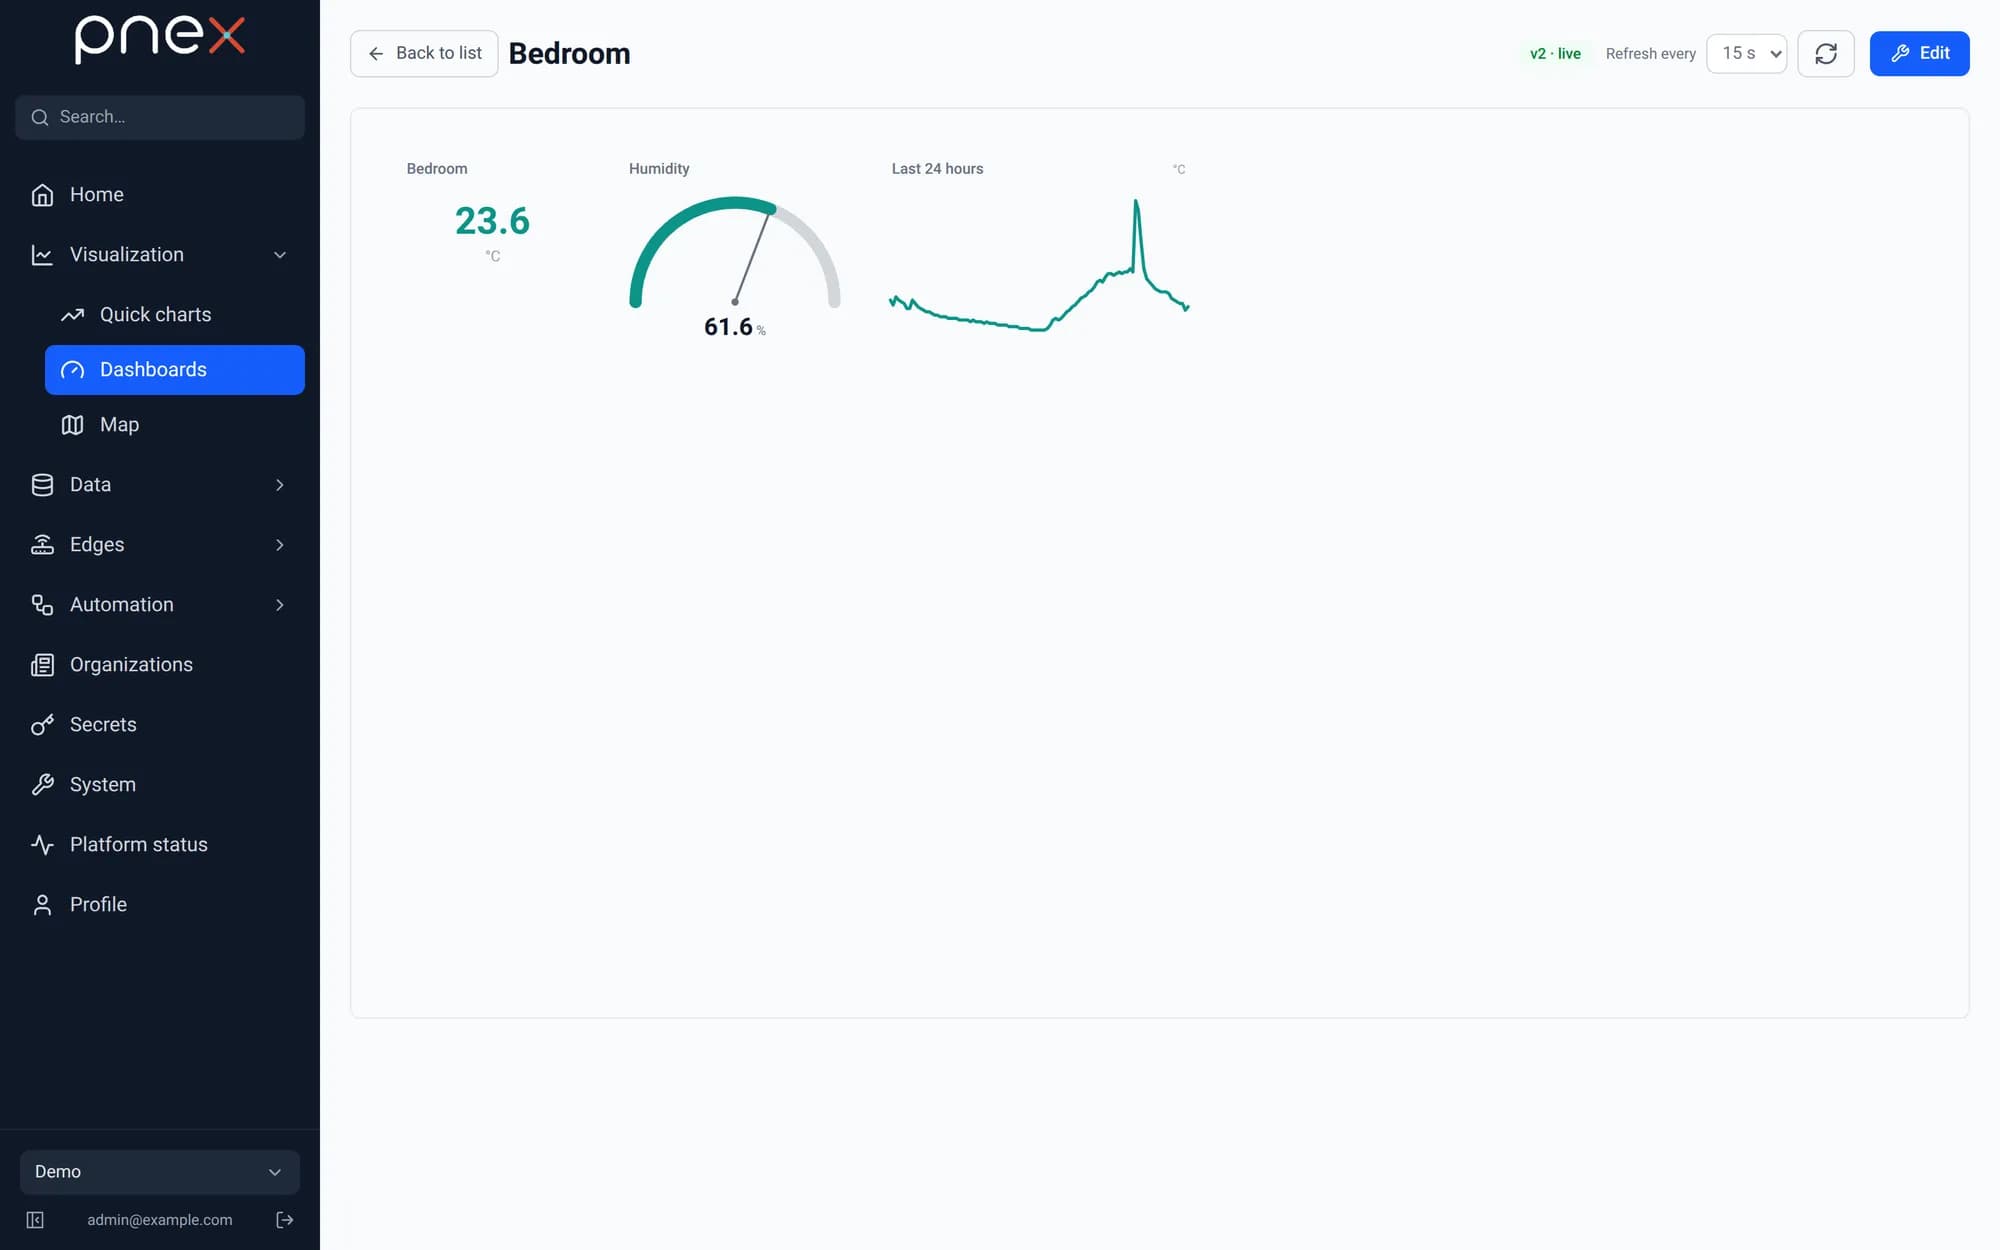
The dashboard refreshes every 15 seconds (Refresh every at the top right).
Troubleshooting
| Symptom | Cause and fix |
|---|---|
climate-1 is missing from the lists | The board has published nothing in the last 24 hours. Check Devices / Agents: is it connected? Then wait for its next reading. |
| The card is grey | Nothing arrived for longer than Stale after. Check the board and its Wi-Fi: the card comes back with the next value. |
| The card says To configure | Temperature is not bound yet: pick temperature under climate-1. |
| The phone shows an old layout | Open the dashboard again: the phone loads the last saved version. |
Going further
- Drive the board's RGB LED from a dashboard: the Bedroom's lamp card lights the LED of the same board.
- Add a Thermostat card fed by
climate-1and a relay: a flow decides, the card only shows the temperature and sets the target.
Before you start
Prerequisites
Finish these tutorials first.
Parts & services
What this tutorial needs.
Boards
Sensors
- 1×AM2301 (DHT21) temperature & humidity sensorWired housing, three wires: red, black, yellow
Tools
- 1×Chrome or Edge (Web Serial)Flashing from the browser needs Web Serial
Already covered by the prerequisites
- Temperature alerts with your own firmware
Raspberry Pi 5 (8 GB) / Raspberry Pi 4 (4 GB+) / Linux VM or server (Debian/Ubuntu) · Waveshare ESP32-C6-Zero · AM2301 (DHT21) temperature & humidity sensor · 10 kΩ resistor · Breadboard · Dupont jumper wires (F-F, M-F) · USB data cable (not charge-only) · 2.4 GHz Wi-Fi network · Chrome or Edge (Web Serial) · ntfy app on your phone
What next?
These tutorials build on this one.